

Laura: Self-driving public transportation. Prototype I.


In February 2010, I joined the Computer Vision Group (CVG). They had an ongoing project led by Siemens and they needed someone with experience in industrial field buses. When I knew the topic, I could not wait to become part of the team and start working. A self-driving transportation system... Quite a dream for a Terminator fan! What I did not know was how much I was going to learn and that my contribution was about to go much further than planned, because I ended up redesigning and extending the Computer Vision algorithms, refactoring the system architecture, creating a wireless teleoperation system and a user interface.
The project aimed to create a driverless vehicle, but with a different goal than the Google car, which had not been unveiled yet. Our system was intended to target the public transportation market, so it was not supposed to drive freely but on predefined marked routes. It was supposed to be like a tram, but with no rails and the possibility to change to another predefined route at some points. The propulsion system, on which I cannot elaborate, required constant accurate vehicle position control on the lane, far from what a human driver could achieve. This was the main reason to automate driving.
First prototype of the self-driving system working on a Citroën C3 with a normal internal combustion engine.
Video by Miguel Olivares and José Luis López.
Siemens was the project leader and the propulsion system developer. Vehicle maintenance, installation of sensors, actuators and low-level controllers were performed by the University Institute of Automobile Research (INSIA). Our role in the CVG was to provide Computer Vision localization and vehicle trajectory control.
The guidance system
Robust vehicle localization was key to meet the requirements, and it was planned as the combination of multiple redundant localization methods. One of them was Computer Vision, which was the task of our group. As the system routes were predefined, the chosen solution consisted in painting a line on the concrete along the known paths. An isolated camera at the vehicle front would detect the line position and a controller would command the steering to follow the line. Simple, right? However, we were going to find some obstacles in our way.
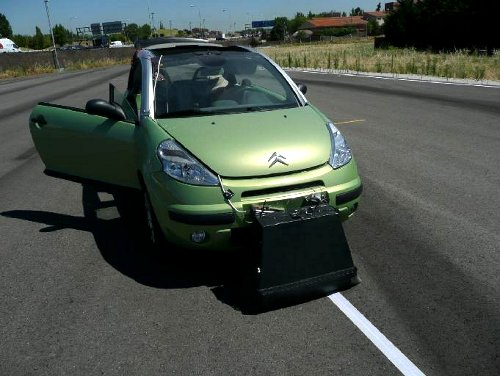
Prototype I with front camera covered by isolator.
Unlike the picture, the line was transparent under daylight; it showed in blue under the UV light inside the isolator.
When I joined, the project had started some time ago and they already had a first prototype —a Citroën C3—. Sensors and actuators were mounted, a color-based visual algorithm was detecting the line and the following error was being passed to a great fuzzy controller by Miguel Olivares that was commanding the steering wheel to follow the line. However, above certain speed, the car was missing the line on curves because the steering wheel dynamics were too slow to reach the turning position on time. The control experts in our team proposed using the known topology of the path in a feed-forward control structure. In that way, the vehicle would anticipate curves and it would start moving the steering wheel earlier to reach the turning point on time. The required steering wheel angle would be given by a kinematic model of the car. The best way to make the system "see the future" seemed to be painting visual marks on the ground, next to the line, before every path segment with a strong curvature change. With a unique mark per segment, any information could be associated to it, besides the segment curvature, like its position in the route, the maximum allowed speed at that point or even the presence of a stop in the next few meters.
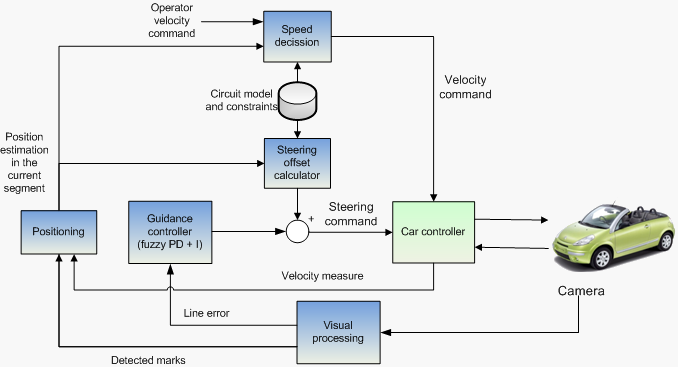
Final trajectory controller diagram with feed-forward steering wheel offset
Visual marks
To identify each path segment we needed to define a large enough set of recognizable marks. The problem was that, at the required vehicle speed (50 kph), any captured shape was blurred along the movement axis and became undistinguishable. Anyway, instead of thinking of the motion blur as a harmful effect, why not trying to take advantage of it? The fact that it only happened in one direction, would let us recognize 1D shapes in the other direction with no problem. So, if we could encode all the information in the good direction, the motion blur would enlarge the codes in the moving direction, giving the visual system a larger pixel mass per code to analyze and, consequently, making it more robust to noise.
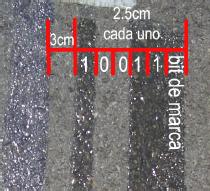 Using that rationale, my proposal consisted in encoding the segment unique identifiers in a barcode basis, with bars parallel to the moving direction, i.e. parallel to the line to follow. However, with the available camera resolution, a barcode wide enough to generate all the needed unique identifiers was too wide to fit in the camera field of view. So, I proposed a more compact encoding. The identifiers would be composed of binary symbols (bits) and every bit would be represented by a constant width bar that would be painted (1) or clear (0) depending on the bit value. Each identifier, would start with a painted bar (start bit = 1) at a predefined distance of the line. This scheme allowed us to robustly encode 6-bit identifiers (1 start bit + 5 code bits) with a width of less than 20% of the camera image, which still leaves space for line following errors to happen while still detecting the codes. At the right side of this paragraph, you can see the line to follow (left) and a mark for identifier 19 (leftmost bar is the most significant bit). The pigments are transparent under visible light, so they have less visual impact, but they are colored under UV light, as seen in the image below from the isolated front camera.
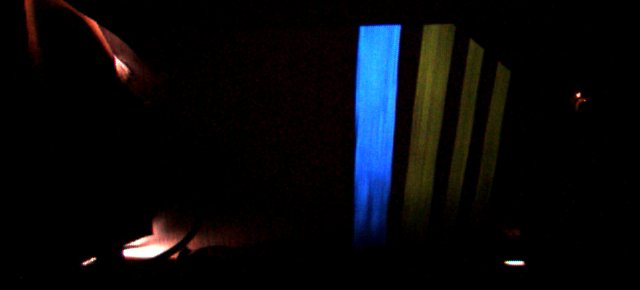
Image from the isolated camera. All pigments are transparent under daylight but blue (line) and yellow (mark) under UV light.
Computer Vision algorithm
The first version of the Computer Vision algorithm was only relying on color to segment the line and marks. The mark detector was not working as expected, though, because sometimes the yellow bars were not straight or had different heights or were too inclined because of the car turning on the track. That was causing many false negatives and wrong identifiers. The deadline was very close and the system kept failing. After thinking about the problem, I was convinced that a combination of color and model-based segmentation would increase the performance.
Despite it was not my assigned task, I wanted to try my approach and proposed it to the team. We had to make it before the deadline and the existing algorithm seemed a dead end, so they told me to go on and try. I grabbed a bunch of images from real tests and spent some time during my summer holidays trying some ideas. Finally, I got something and, after the first two (sleepless) weeks of September 2010, my C++ implementation was ready and running on the onboard Linux Ubuntu. The resulting algorithm solved all the problems and it was robust enough to work under harsh conditions: multiple lines, partial occlusions, daylight noise, non-compact shapes due to rough terrain and bad quality painting, any angle of the car over the line, wide range of acceptable pigment colors. It was even able to rise an alert when a mark needed to be repainted.
Color-based segmentation
The first stage of the algorithm is a color segmentation. I chose the YUV color space because: it is close to the human perception, it separates color and luminance and it was the native color system of the camera. The implemented color segmentation module allows the user to configure two volumes in the YUV space: one for the line and one for the marks. Only pixels inside the volumes are picked as line or mark. In the image below, you can see the previous image after passing the segmentation module. I chose the volumes to be quite large, so the filtering was not too restrictive. All in all, there is a second model-based filter that will cut all the remains off.
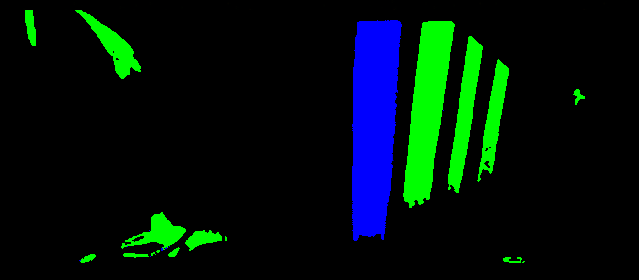
The image above after passing the color segmentation module.
Model-based segmentation
For model-based segmentation, all connected pixels are first grouped into "blobs". This renders a set of potential line blobs and a set of potential mark blobs. For every blob, regardless of its kind, some features are extracted, like the centroid, the dominant direction or the total pixel area.
For the line to follow, adjacent blobs that are parallel to each other in the vertical direction are joined together. This makes the algorithm robust with degraded paint on rough concrete. All blob groups are then compared to a line model; groups not meeting the model are discarded; the rest are considered candidate lines. When there is a path bifurcation, the system selects a line among the candidates depending on the information of the last decoded mark, as it is associated to a preferred bifurcation branch in the database. In this way, configurable routes are possible. Without a prior mark, the selected line at every frame is the candidate that is closer to the line in the last frame. This allows to filter out the line remains of old paths.
For the marks, the potential mark blobs are filtered with mark and line-to-mark models, which are defined by the minimum bar width and height, the valid range of bar aspect ratios, the correct line side at which mark bars can be, the valid angle range between line and mark bars, the valid distance between line and mark bars, etc. The survivors after filtering are considered parts of the mark.
Mark decoding
The mark blobs after the model-based segmentation should be (ideally) rectangles of different sizes, each of which represents a group of bits with value 1. Every blob is compared against a set of all possible bit group rectangular patterns, which are generated with a height equal to the blob's height. The closest pattern will determine the actual number of 1 bits in the group. This method is more robust than simply dividing the blob width by the bit width because the mark bars are seldom rectangular in the real world and the blob may be thinner (degraded paint) or wider (painting mistake) depending on the point at which you measure its width.
For speed, the comparison is not performed pixel by pixel. Only two key features are compared for every pattern: (1) a blob-area to pattern-area ratio and (2) a blob-pixels-inside-pattern to total-blob-pixels ratio. A valid range is defined for every ratio and only the patterns performing in both valid ranges are taken into account for the distance-to-blob comparison. As the valid range for (1) is applied first, only patterns with an area similar to the blob's area are evaluated in (2). This ensures that (2) approximately behaves as a shape similarity indicator.
Once the bit groups are classified, they are projected on the mark's baseline. The baseline is the line that is perpendicular to the mark average dominant direction. In the resulting bit vector, the rightmost is identified as the start bit and the rest form the binary-encoded identifier, where the leftmost bit is the most significant. This is done for every frame. However, the final decoded value is based upon a voting process where the last N frames take part. Higher N figures give more reliability, while lower values give lower delay. Obviously, choosing an odd N avoids ties. For instance, in the video above, N was 3. If the vehicle speed is too high to capture at least N frames with the mark, the decision is taken with the available frames and the result is notified to the system together with a "level of confidence" value.
Results
The following video sequences correspond to test routes. They have been slowed down to better observe what is happening. The results of the line and mark detectors have been overlaid on the sequence. Every significant detected blob is marked with its centroid (green circle) and its dominant direction (red line). The detected distance between the image center (purple circle) and the line to follow, which is the input for the trajectory controller, is represented by the purple horizontal line. The bounds of the detected mark bars are highlighted in cyan. The number of bits in every mark bar is depicted as an equal number of yellow circles on it. Finally, the decoded identifier value is written in yellow on the mark. There is a brief explanation of every situation under each video sequence.
The line is detected despite changing width. A false blob is detected at the right side of the line in some frames due to old path remains, but the algorithm is able to filter it out and track the correct line. Marks with identifiers 10, 26 and 9 are correctly decoded in all the frames where they are detected.
In this sequence, the system output is overlaid at the upper left corner. Thanks to voting, an identifier 25 is correctly decoded, despite one incorrect frame with value 17. As N=3, during the first two frames with a mark, the system decision is "No code". In the third frame, there are enough frames for voting and the system outputs the new detected identifier with "Code: 25 (new!)". In the following frames the system keeps on notifying "Code: 25", as it is still visible, although it is not new. Notice how, together with the new detected code, the system alerts of the need to repaint the mark because of low average brightness.
A second line appears, but the system sticks to the one that it was following until they overlap at the upper part. After that, a mark with identifier 9 is correctly decoded.
Teleoperation system
Despite the system drives on its own, a human operator is able to set the desired driving speed. The system will try to follow the order, provided that it is lower than the maximum speed configured for the route segment and there is no programmed stop at its location. In this way, if the configuration is right, there is no possibility for the operator to take the vehicle outside the safety limits. Anyhow, in the case of an emergency, the operator can start an emergency stop and the vehicle will suddenly brake. On the other hand, the operator has to be informed at all times about the system situation: current speed, current location, alarms (stopped due to missing line, faulty communications, ...), system status, segment identifier, route characteristics, etc.
For all those interactions between the operator and the vehicle I designed a wireless teleoperation system on IP sockets. At the prototyping environment, we used it over WiFi, which was giving enough range with no errors. As first task, I defined the communication protocol and implemented the vehicle teleoperation server. The communication was organized into channels, each of which was implemented on a socket, either UDP or TCP depending on the delay requirements of the information flow through them. I paid especial attention to safety and implemented fault modes, so every channel was robust to temporary signal loss and able to self-recover.
There were two teleoperation front-ends: one of them, developed by a coworker, accessed the server from an industrial PLC in a remote base station; the second one, my development, consisted in an operator interface for Windows machines, programmed with C#. The latter proved to be useful during system tuning, not only as an easy way to check the important information, but a mean to start the system in different test points along the route.
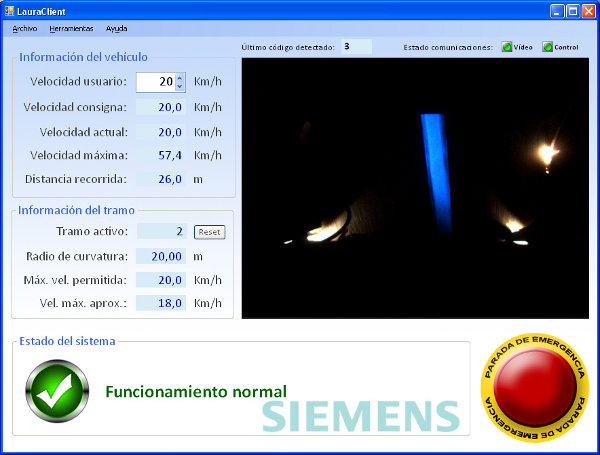
Teleoperation front-end for Windows
Greetings
I have especially elaborated on my tasks —after all, it is my portfolio, right?  —, but the results are obviously the fruit of a common effort of the whole team. Special greetings and thanks go to all the CVG members that participated in the project: Miguel A. Olivares Méndez, Pascual Campoy, José Luis Sánchez López, Iván F. Mondragón and Carol Martínez. Greetings also go to Antonio Sanz Gil, Marta Robles and all other collaborators from Siemens and INSIA that made it possible.